De ideale oplossing voor het gestructureerd testen voor wetenschaps- en onderzoeksdoeleinden
Eye-tracking geeft een uniek inzicht in de menselijke visuele herkenning dat niet met eenvoudige observatie kan worden ontdekt. Presenteer dezelfde media (foto’s / films / websites) om proefpersonen gestructureerd te testen en evalueer de gegevens vervolgens statistisch met een Area-of-Interest analyse. Maak indrukwekkende visualisaties, zoals Gaze Replay grafieken en video’s, Focus Maps of Maps Heat.
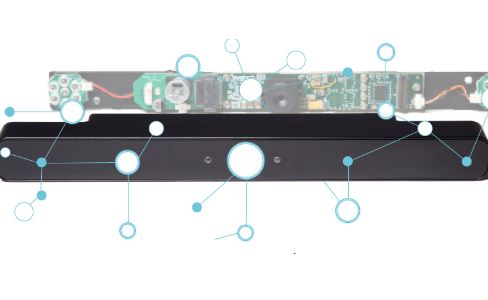
MangoldVision ondersteunt u professioneel in uw eye tracking studies en registreert de staarpatronen en het gedrag van uw proefpersonen.
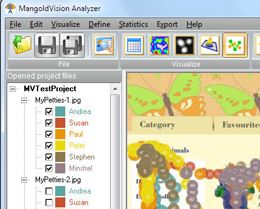
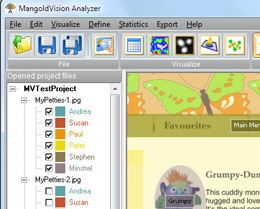
Project-design
Ontwerp uw project moeiteloos met Drag&Drop in MangoldVision.
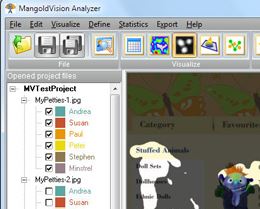
Eye-tracking test
MangoldVision stuurt uw project automatisch aan en begeleidt uw proefpersonen door middel van de eye-tracking studies.
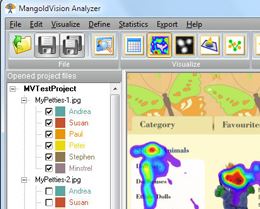
Analyses & visualizatie
MangoldVision analyseert en visualiseert uw eye-tracking gegevens op een betrouwbare en professionele manier.
Features
- Modular software suite for great flexibility
- Large variety of different stimuli and recording options
- Questionnaires & demographic data for easy data selection
- Easy project re-organization and merging for a smooth workflow
- Multidimensional stimuli-randomization for scientific reliability
- Participant video recording to capture the full user experience
Programs
Gaze Plot
Gives an excellent insight into the viewing behavior and gaze patterns of your participants. See how they have explored your visuals.
Focus Map
A real aha experience for every researcher, designer or developer! See what your test subjects really have seen and what they did not look at.
Heat Map
Shows at a glance the “high energy” areas of a stimulus to which your participants were focusing.
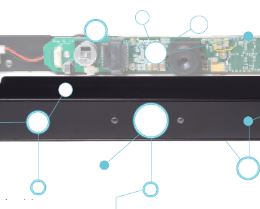
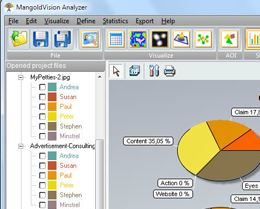
Areas of Interest
Simply define parts of a picture or a video for which you wish to get statistical results. MangoldVision will automatically calculate various key indicators relating to the eye movements of your test subjects.
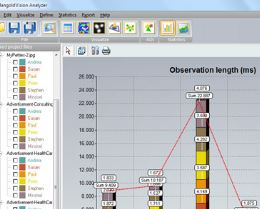
AOI Gaze Pattern
The Gaze Pattern Chart gives a very good impression of which specific areas-of-interest the participants have seen in which order.
Physiological Measurements
See physiological measurements in combination with the recorded data to get more insight into the real experience of your participants.
Statistical Results
Statistical results are calculated from the gaze data at the push of a button. This makes it easy for you to interpret data, prepare reports and compare studies.
Export and Visualization
MangoldVision offers various data export possibilities and amazing chart options.